reports & analytics
When it comes to data, we are passionate! From initial design to final delivery, we work with our clients to deliver results that make sense and are engaging.
Don’t accept less than the best for your feedback projects. Working with We Love Surveys will give you access to some of the worlds best tools for analytics, for both your quantitative and qualitative feedback, because one without the other is only half a story.
accelerate your organisational success with the implementation of powerful analytics

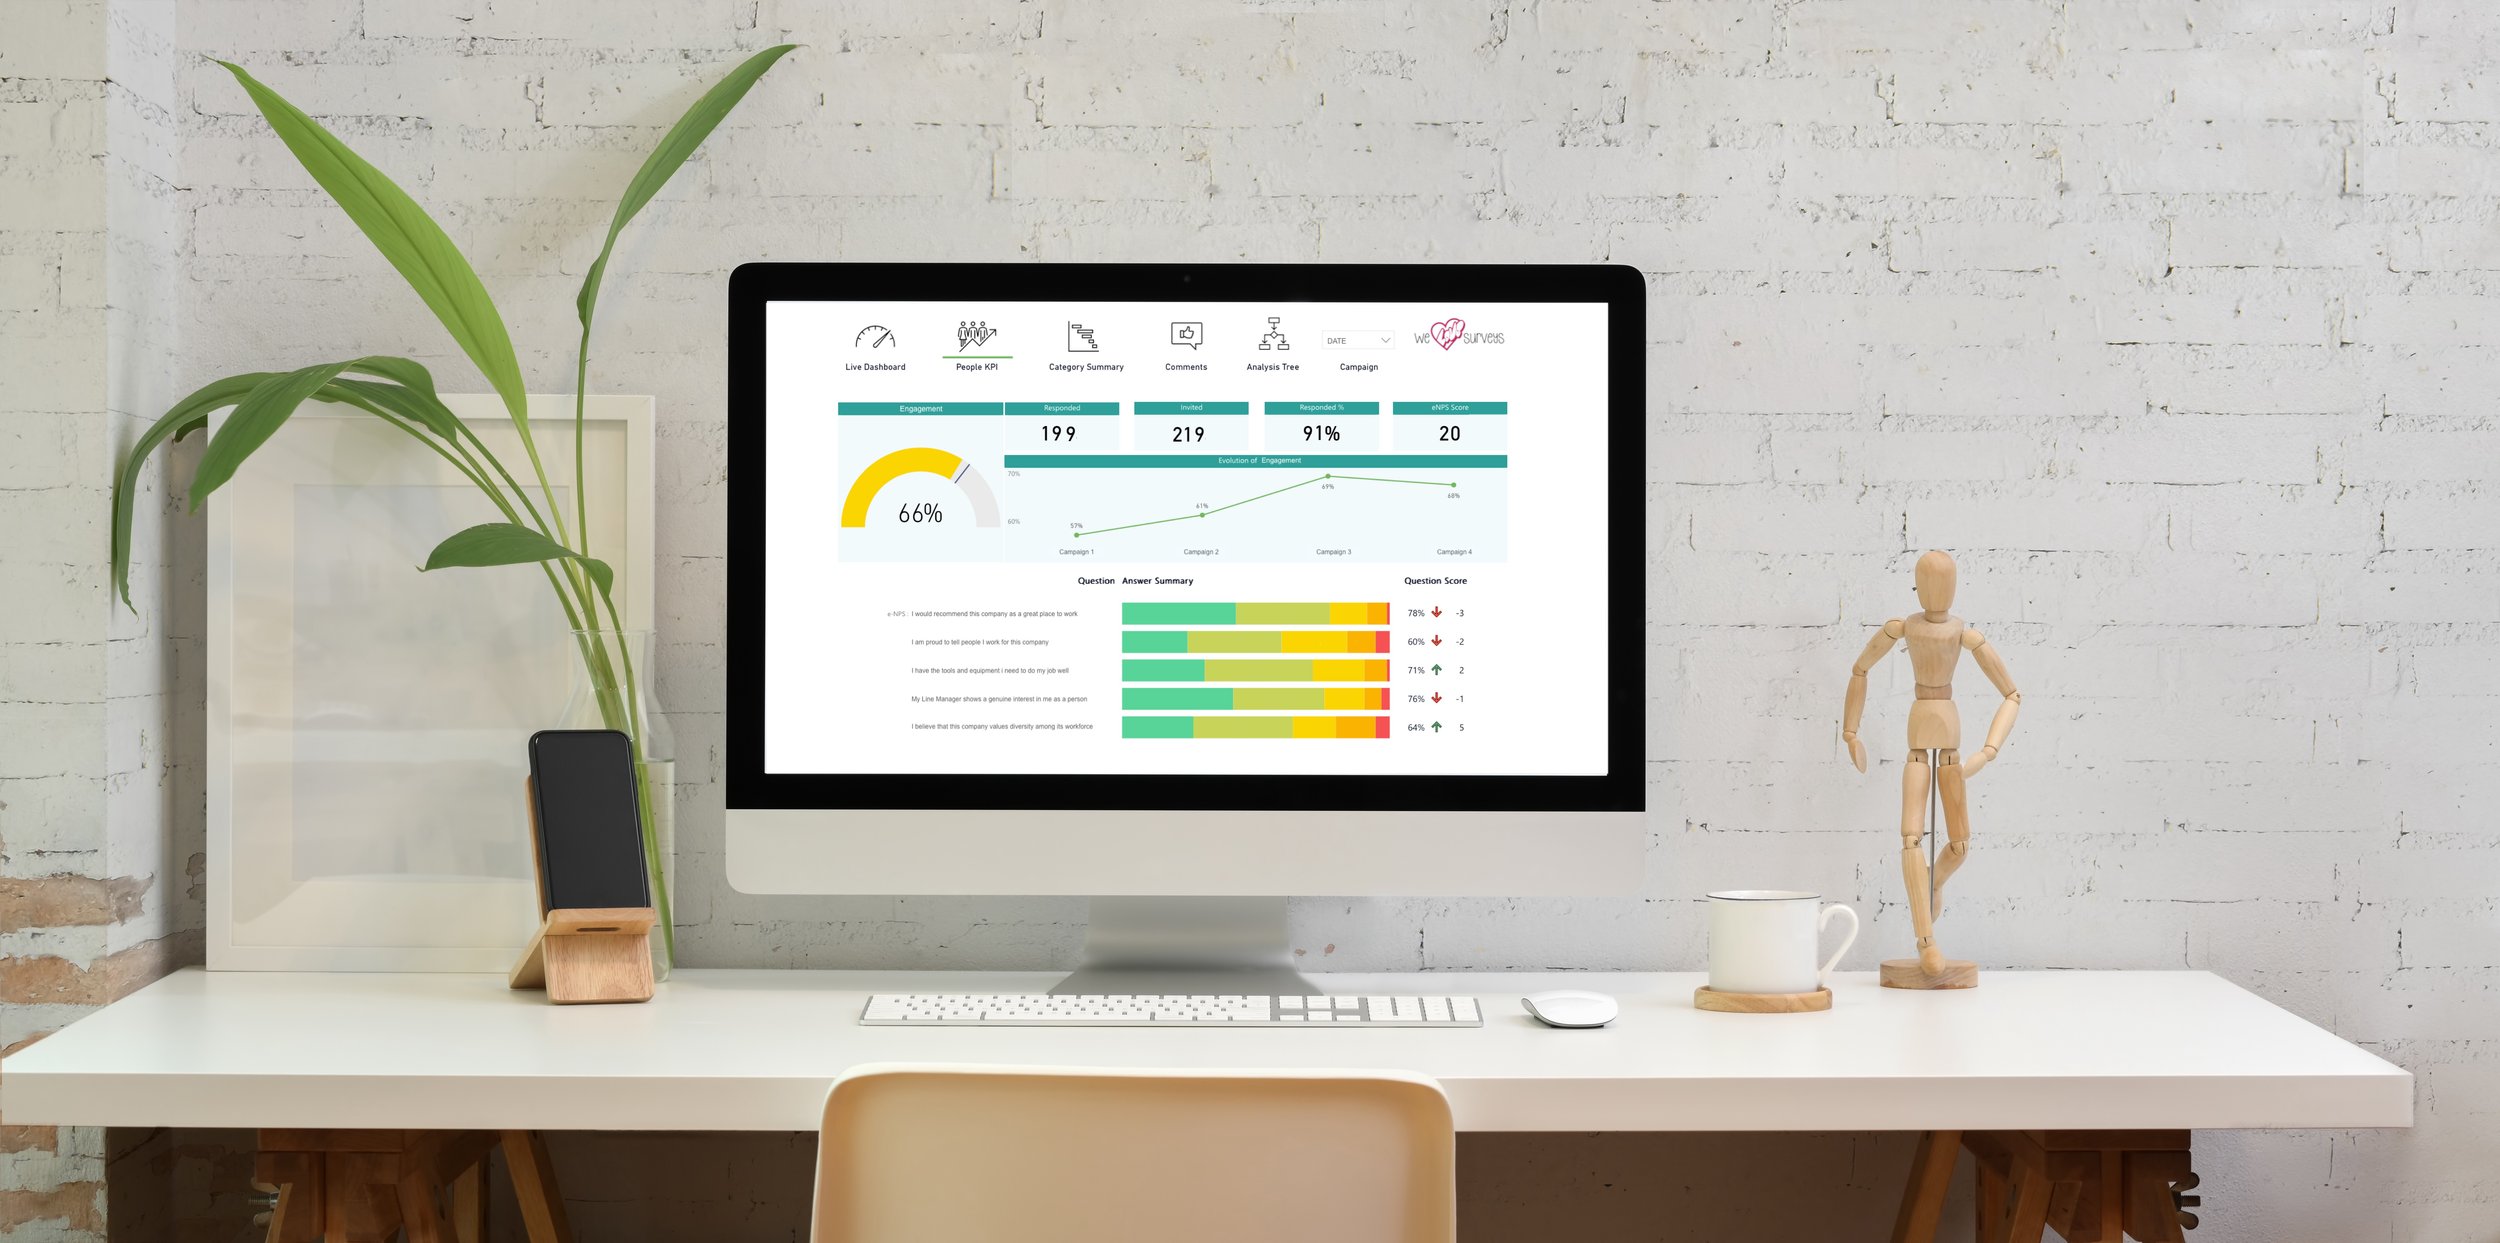
MICROSOFT POWER BI DASHBoards
We are a Microsoft Partner and offer embedded Power BI via our Your Voice reports portal to as many users as you need.
With our dedicated dashboard developer you can be sure that your data will tell an informative and engaging story using the latest visuals and technology to show your results in way they ensures it is accessible for all.
Secure, user specific access rights
Latest advances in AI technology to better understand your data
Bespoke design for your organisation

advanced comment analytics
If you are collecting comments and struggling to make sense of them or the impact of peoples words on their ratings, we can help.
We have partnered with a world leading impact analytics software, to bring our clients access to one of the most powerful analytics engines you will find. Whether you want us to analyse comments we have collected or you simply have a chunk of comments that you need to understand, we can support you.
For more information on our comment analysis offer, click here

Board Level Briefing Packs
Analysing data from a survey is complex and relies on the reviewer approaching without bias or pre determined ideas of what is expected in the results.
We can independently analyse your results and produce insight and recommendations from your data, using a range of tools available to us, including AI for analysing comments and uncovering themes.
Our board level briefing packs are extremely popular and can also be presented by our CEO if you require.

automated & PDF reports
Dashboards are great but they aren’t appropriate for every audience or recipient of insights from you data.
If you are looking for a modern, clear and user freindly report but would prefer to distribute a PDF (or other fornat) copy then we can help.
Since 2004 we have been sending reports by email on schedules defined by our clients so we know that this format works well and gets results directly into the hands of those that need them.